前言
想要部署一个自己的网站监控站点,虽然此前已经在serv00上部署了Uptime Kuma,但不是很靠谱,部署在自己的服务器上不符合白嫖精神,某天在awesome-cloudflare上看到UptimeFlare这个项目能在Cloudflare 上实现站点监控,前来折腾,记录一下部署过程。DEMO:https://status.kafuchino.top
正式开始
部署Uptimeflare
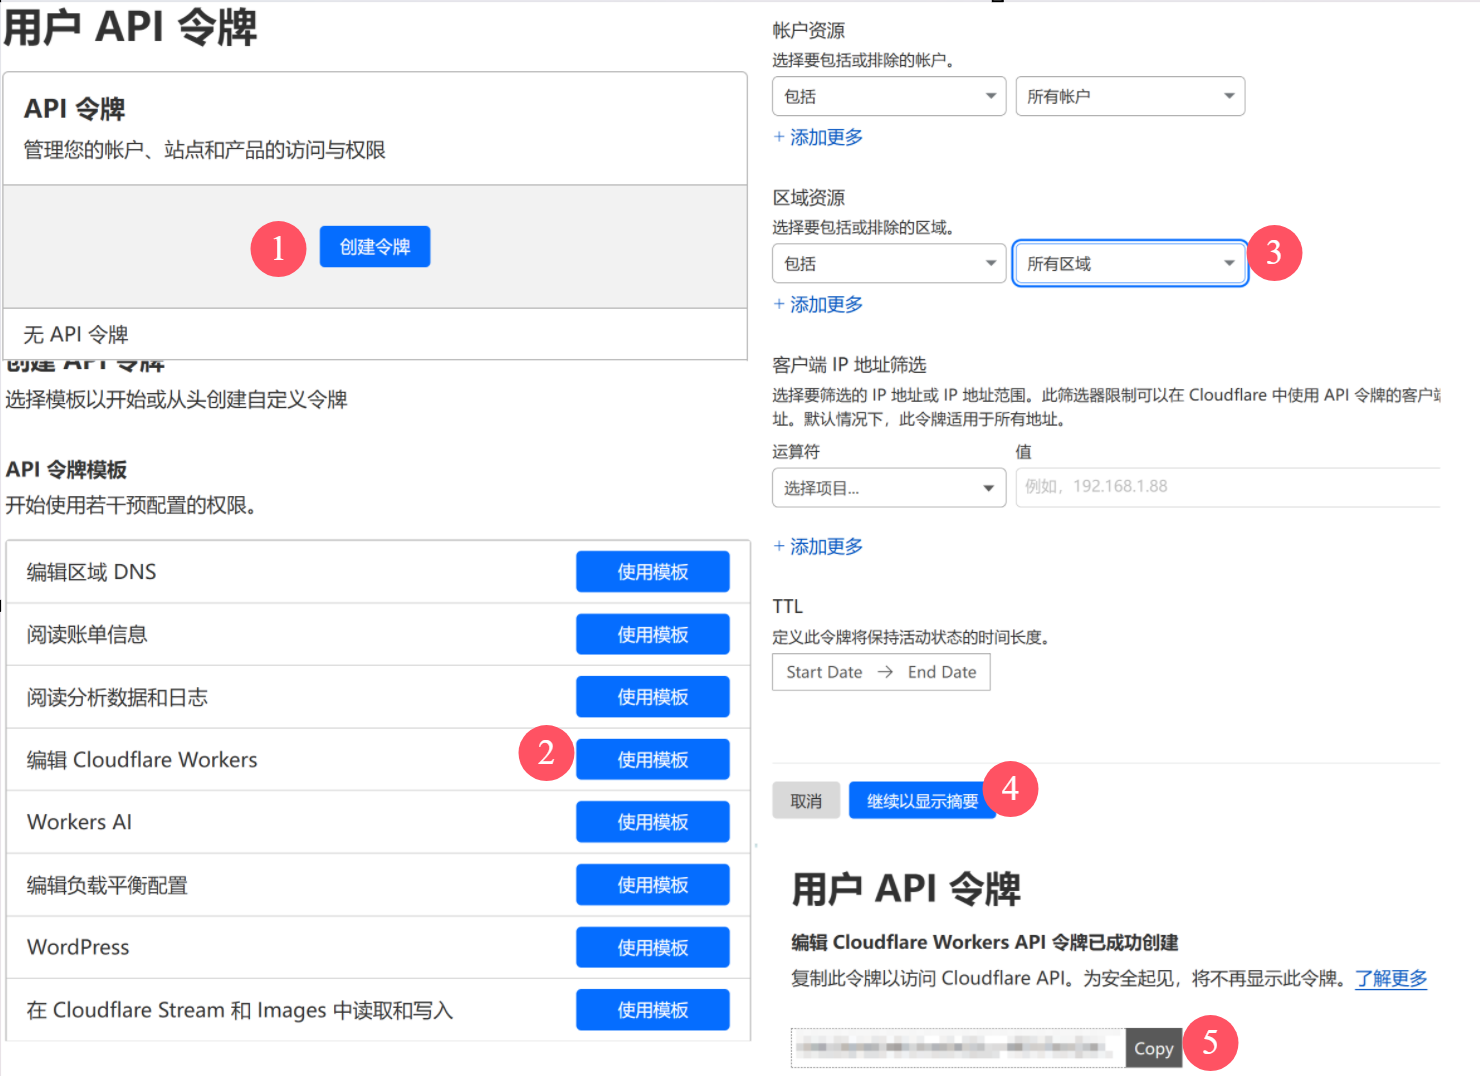
- 使用模板在https://dash.cloudflare.com/profile/api-tokens 创建 API 令牌。点击
编辑 Cloudflare Workers,账户资源选择所有账户,区域资源选择所有区域, 复制你的api密钥
通过单击 在您的帐户中创建此 repo的副本
Use this template。(如果你不想希望其他人看到你的服务器ip,建议将其设为私有)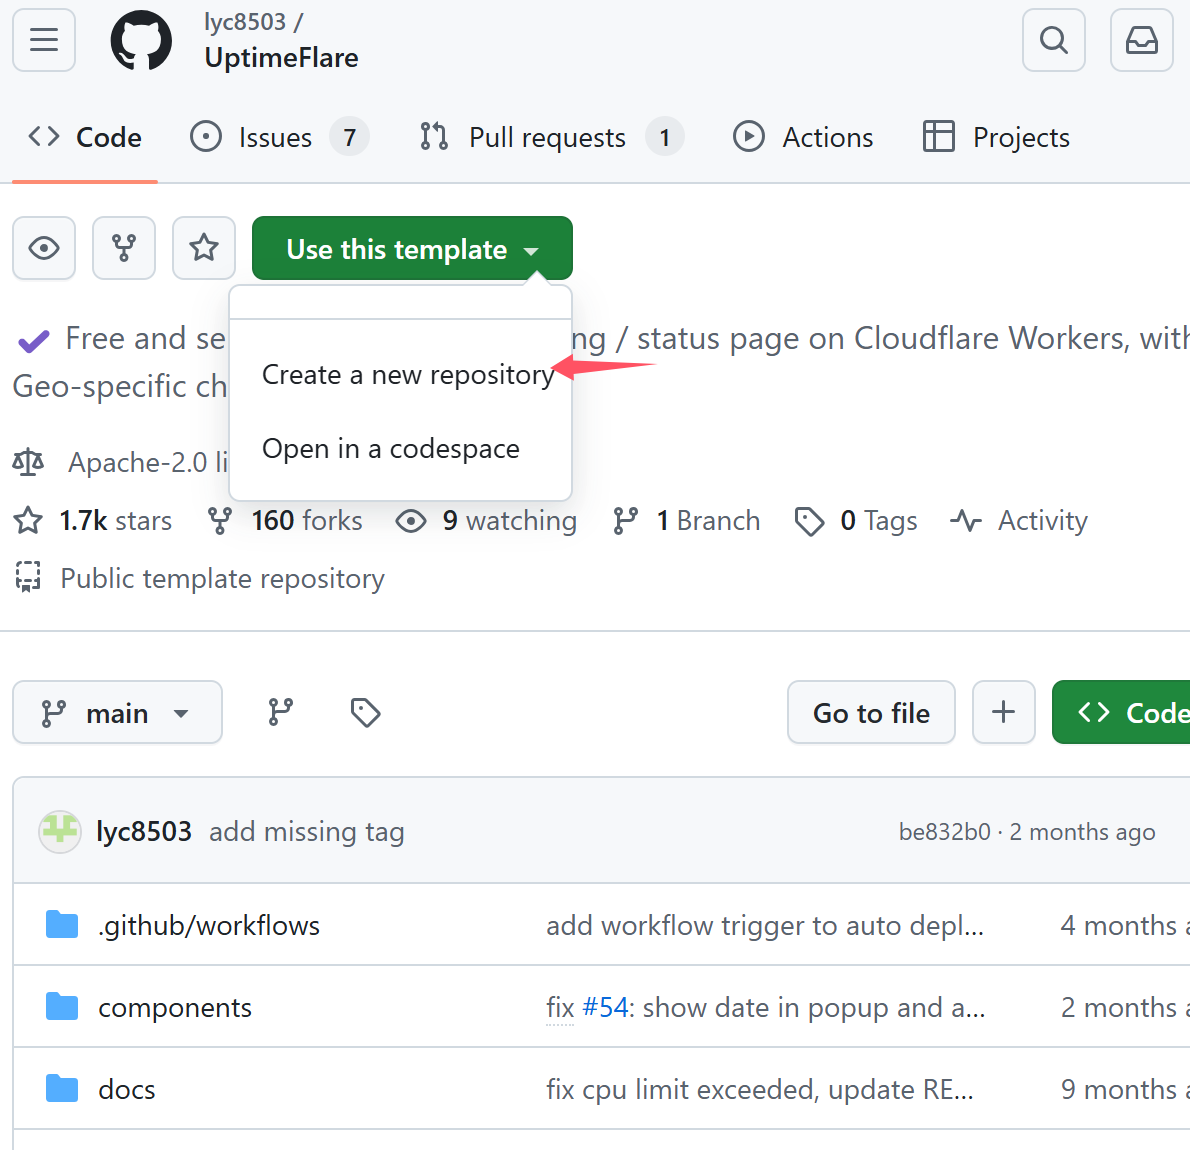
设置你的 Cloudflare API Token
Settings -> Secrets and variables -> Actions,设置一个密钥,名称为CLOUDFLARE_API_TOKEN,值是你在步骤 1 中获得的令牌。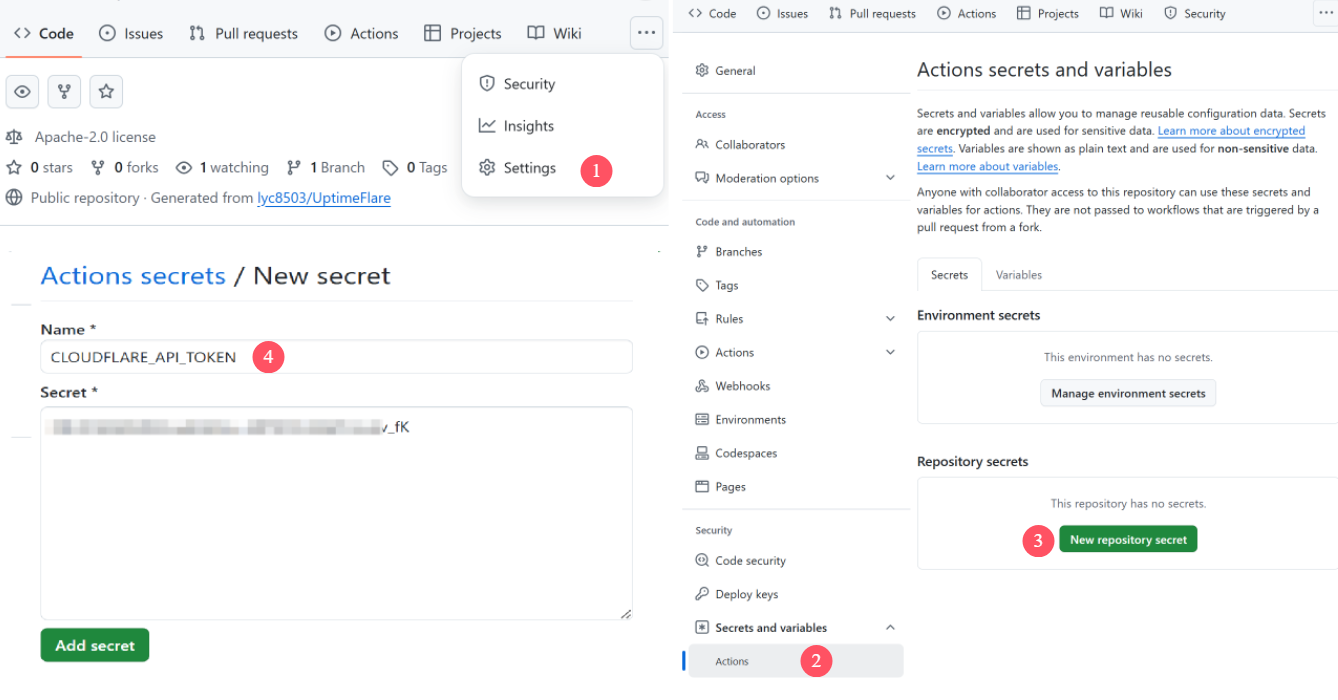
手动触发
Actions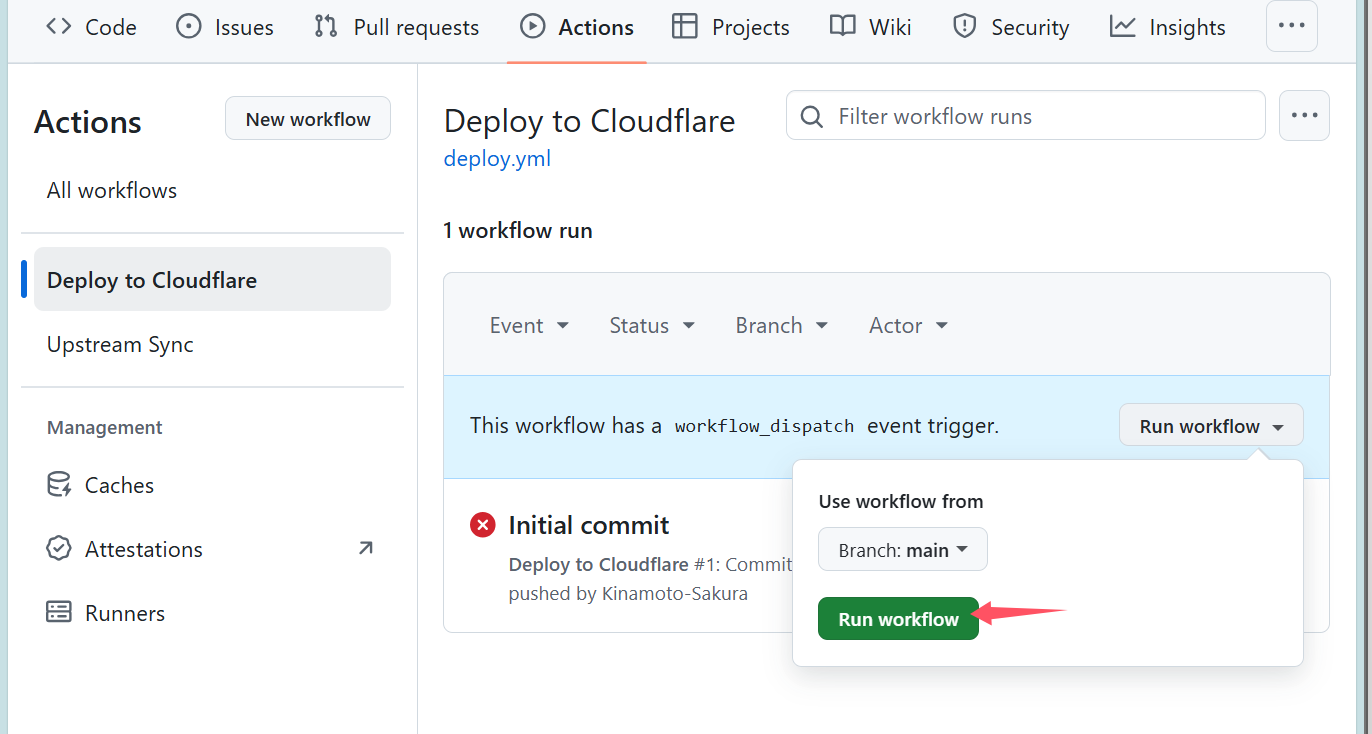
等待4分钟左右就会部署完成,这时候就可以到
Pages点击访问来查看效果了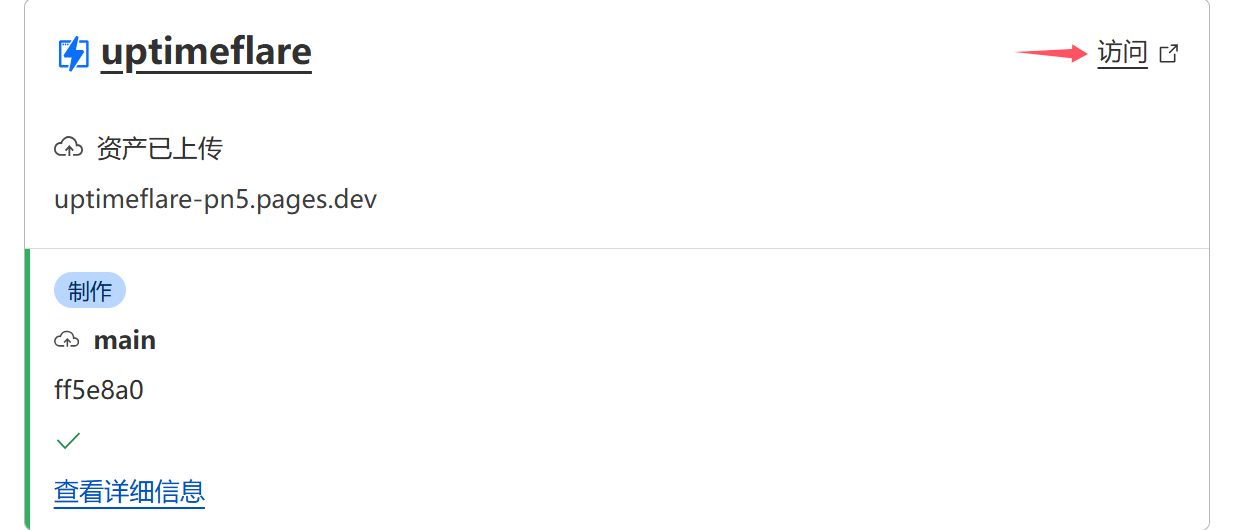
- 你可以配置Actions来自动同步上游更新
在你自己的存储库中转到
Actions-Upstream Sync-Run workflow。这会触发自动更新。等待片刻(少于 30 秒)后,刷新页面,你就可以看到新触发的任务及其执行结果。如果显示绿色对勾,则表示代码已成功更新。
如果更新出现问题(运行的操作带有红色叉号),点击相应条目可以查看详细的错误日志:
nothing to commit, working tree clean:这意味着已经是最新版本,无需更新refusing to allow a GitHub App to create or update workflow .github/workflows/xxx.yaml without workflows permission:这意味着此存储库的工作流文件已更新,这是正常的,有时会发生。在这种情况下,Actions 无法在没有 token 的情况下自行更新,你需要在此处手动创建具有Workflows和Contents权限的 token,重试时将其放入上图中的输入框中。更新成功后,你可以安全地删除不再需要的 token。- 如果更新后部署出现错误,您可能需要检查最新的文档以查看配置文件是否已更改。
配置Uptimeflare监控文件
- UptimeFlare 的所有配置都在
uptime.config.ts,带注释的完整版本如下:
// 页面配置
const pageConfig = {
  // 状态页面的标题
  title: "lyc8503's Status Page",
  // 显示在状态页面头部的链接,可以设置 `highlight` 为 `true` 来高亮显示
  links: [
    { link: 'https://github.com/lyc8503', label: 'GitHub' },
    { link: 'https://blog.lyc8503.net/', label: 'Blog' },
    { link: 'mailto:me@lyc8503.net', label: 'Email Me', highlight: true },
  ],
}

// 工作器配置
const workerConfig = {
  // 除非状态发生变化,否则最多每3分钟写入一次KV存储
  kvWriteCooldownMinutes: 3,
  // 通过取消注释下面的行来为状态页面和API启用HTTP基本认证,格式为 `<用户名>:<密码>`
  // passwordProtection: 'username:password',
  // 定义所有监控项
  monitors: [
    // HTTP监控示例
    {
      // `id` 应该是唯一的,如果 `id` 保持不变,历史记录将被保留
      id: 'foo_monitor',
      // `name` 用于状态页面和回调消息
      name: 'My API Monitor',
      // `method` 应该是一个有效的HTTP方法
      method: 'POST',
      // `target` 是一个有效的URL
      target: 'https://example.com',
      // [可选] `tooltip` 仅用于状态页面显示工具提示
      tooltip: 'This is a tooltip for this monitor',
      // [可选] `statusPageLink` 仅用于状态页面的可点击链接
      statusPageLink: 'https://example.com',
      // [可选] `expectedCodes` 是可接受的HTTP响应代码数组,如果未指定,默认为2xx
      expectedCodes: [200],
      // [可选] `timeout` 以毫秒为单位,如果未指定,默认为10000
      timeout: 10000,
      // [可选] 要发送的头部
      headers: {
        'User-Agent': 'Uptimeflare',
        Authorization: 'Bearer YOUR_TOKEN_HERE',
      },
      // [可选] 要发送的主体
      body: 'Hello, world!',
      // [可选] 如果指定,响应必须包含关键词才被视为正常运行
      responseKeyword: 'success',
      // [可选] 如果指定,检查将在您指定的区域运行,
      // 在设置此值之前,请参考文档 https://github.com/lyc8503/UptimeFlare/wiki/Geo-specific-checks-setup
      checkLocationWorkerRoute: 'https://xxx.example.com',
    },
    // TCP监控示例
    {
      id: 'test_tcp_monitor',
      name: 'Example TCP Monitor',
      // 对于tcp监控,`method` 应为 `TCP_PING`
      method: 'TCP_PING',
      // 对于tcp监控,`target` 应为 `主机:端口`
      target: '1.2.3.4:22',
      tooltip: 'My production server SSH',
      statusPageLink: 'https://example.com',
      timeout: 5000,
    },
  ],
  notification: {
    // [可选] apprise API服务器URL
    // 如果未指定,将不会发送通知
    appriseApiServer: "https://apprise.example.com/notify",
    // [可选] apprise的接收者URL,参考 https://github.com/caronc/apprise
    // 如果未指定,将不会发送通知
    recipientUrl: "tgram://bottoken/ChatID",
    // [可选] 通知消息中使用的时区,默认为 "Etc/GMT"
    timeZone: "Asia/Shanghai",
    // [可选] 发送通知前的宽限期(分钟)
    // 只有在监控连续N次检查后仍然处于故障状态时才会发送通知
    // 如果未指定,将立即发送通知
    gracePeriod: 5,
  },
  callbacks: {
    // 当任何监控的状态发生变化时,将调用此回调
    onStatusChange: async (
      env: any,
      monitor: any,
      isUp: boolean,
      timeIncidentStart: number,
      timeNow: number,
      reason: string
    ) => {
      // 在此处编写任何TypeScript代码

      // 这不会遵循宽限期设置,状态变化时将立即调用
      // 如果要实现宽限期,需要手动处理
    },
    // 如果任何监控存在持续的故障,将每1分钟调用一次此回调
    onIncident: async (
      env: any,
      monitor: any,
      timeIncidentStart: number,
      timeNow: number,
      reason: string
    ) => {
      // 在此处编写任何TypeScript代码
    },
  },
}

// 不要忘记这个导出,否则编译将失败
export { pageConfig, workerConfig }- 页面配置
PageConfig主要是状态页相关的配置项,包括状态页的标题,状态页右上角的链接,你可以改为你自己的博客地址,github地址,邮件等
const pageConfig = {
  title: "lyc8503's Status Page",
  links: [
    { link: 'https://github.com/lyc8503', label: 'GitHub' },
    { link: 'https://blog.lyc8503.site/', label: 'Blog' },
    { link: 'mailto:me@lyc8503.site', label: 'Email Me', highlight: true },
  ],
}网页监视配置示例
一个基本的网页监控配置,
name是显示的名称,target填你要监控的网站地址,tooltip是备注,statusPageLink是状态页面的可点击链接,详细的解释参考上文的注释ts{ id: 'blog_monitor', // 更改为唯一的ID name: 'Chino\'s Blog Monitor', method: 'GET', target: 'https://blog.kafuchino.top', tooltip: 'This is a tooltip for this monitor', statusPageLink: 'https://blog.kafuchino.top', },服务器监视配置示例,
target填写服务器ip:ssh端口
    {
      id: 'test_tcp_monitor',
      name: 'Example TCP Monitor',
      method: 'TCP_PING',
      target: '1.2.3.4:22',
      tooltip: 'My production server SSH',
      statusPageLink: 'https://example.com',
      timeout: 5000,
},完成配置填写后,Action会自动运行,等待几分钟,就可以查看网页监控了,效果如下: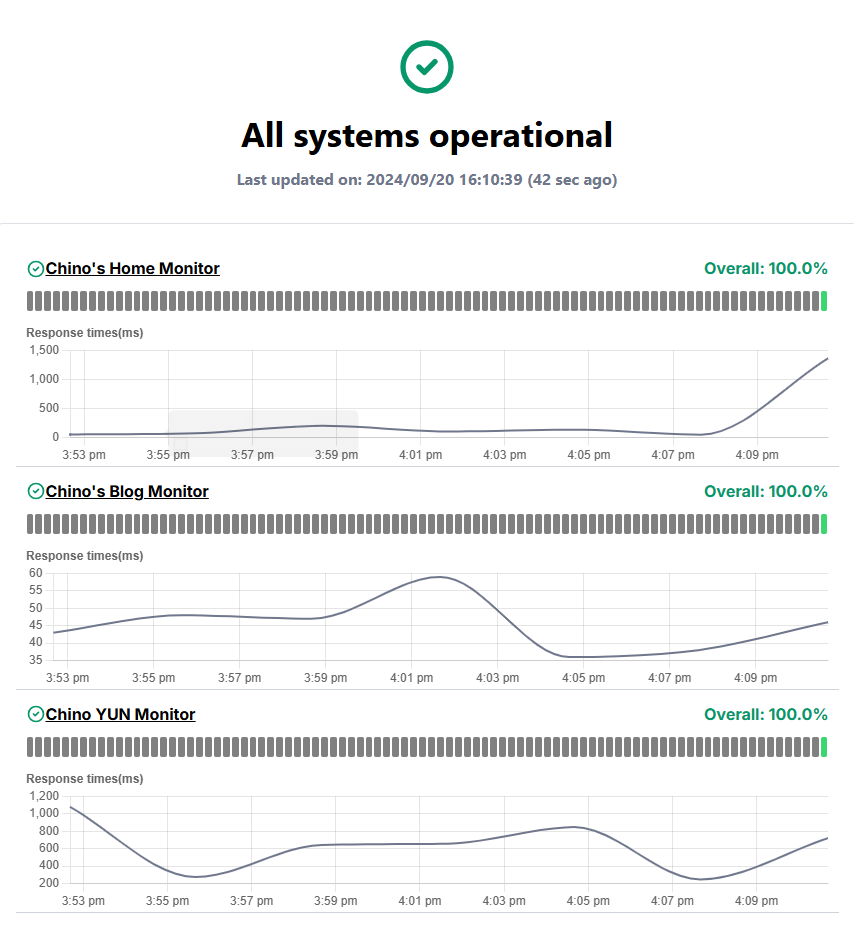
配置特定区域检查(可选)
虽然 Cloudflare 官方不支持指定 Worker 运行的区域,但可以用这个办法方法来实现这一目标。你必须在 Cloudflare 上拥有一个域名,如果你在 Cloudflare 上没有域名,可以注册一个免费域名(例如 https://customer.l53.net)。该域名仅供内部使用,不会对外可见。具体的筛选ip方法可以参考原作者的文档 Geo specific checks setup,这里填写选好的ip8.34.201.7,位置是Japan/Okinawa,无论是用来检测国内还是国外服务器延迟都在可接受访问内。
首先在 Cloudflare 仪表板中转到到你的域名,然后单击
Workers Route部分的Add route来添加一个路由规则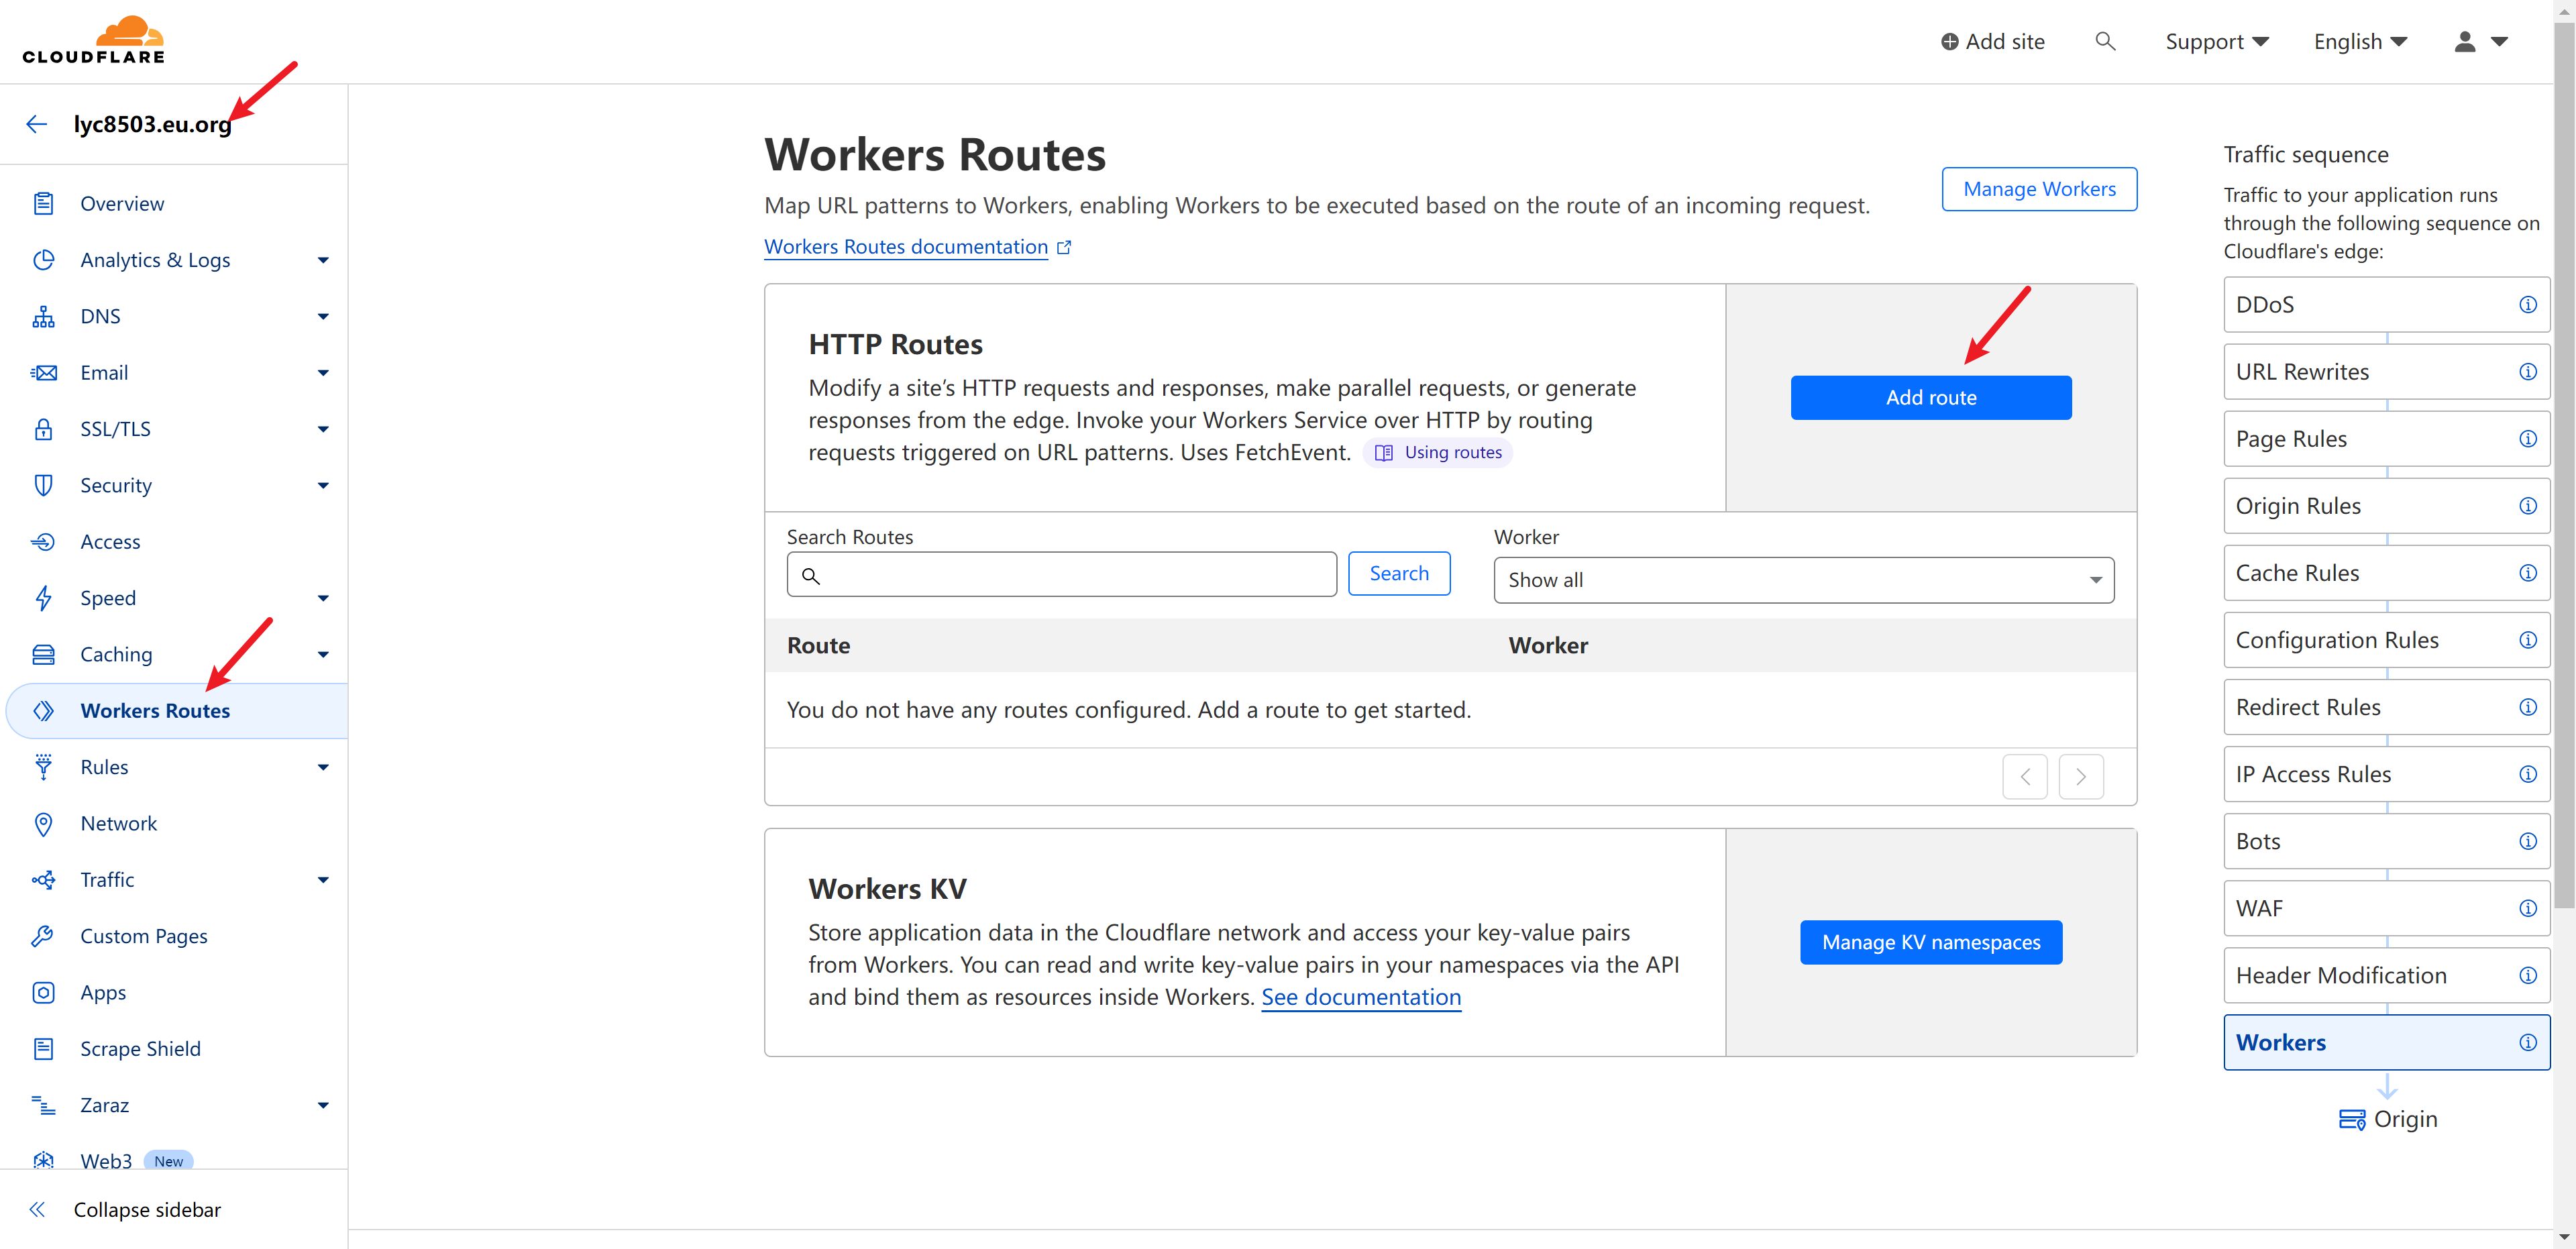
填写域名前缀。比如使用
jp(日本),输入jp.lyc8503.eu.org/*路线并选择uptimeflare_worker,然后单击Save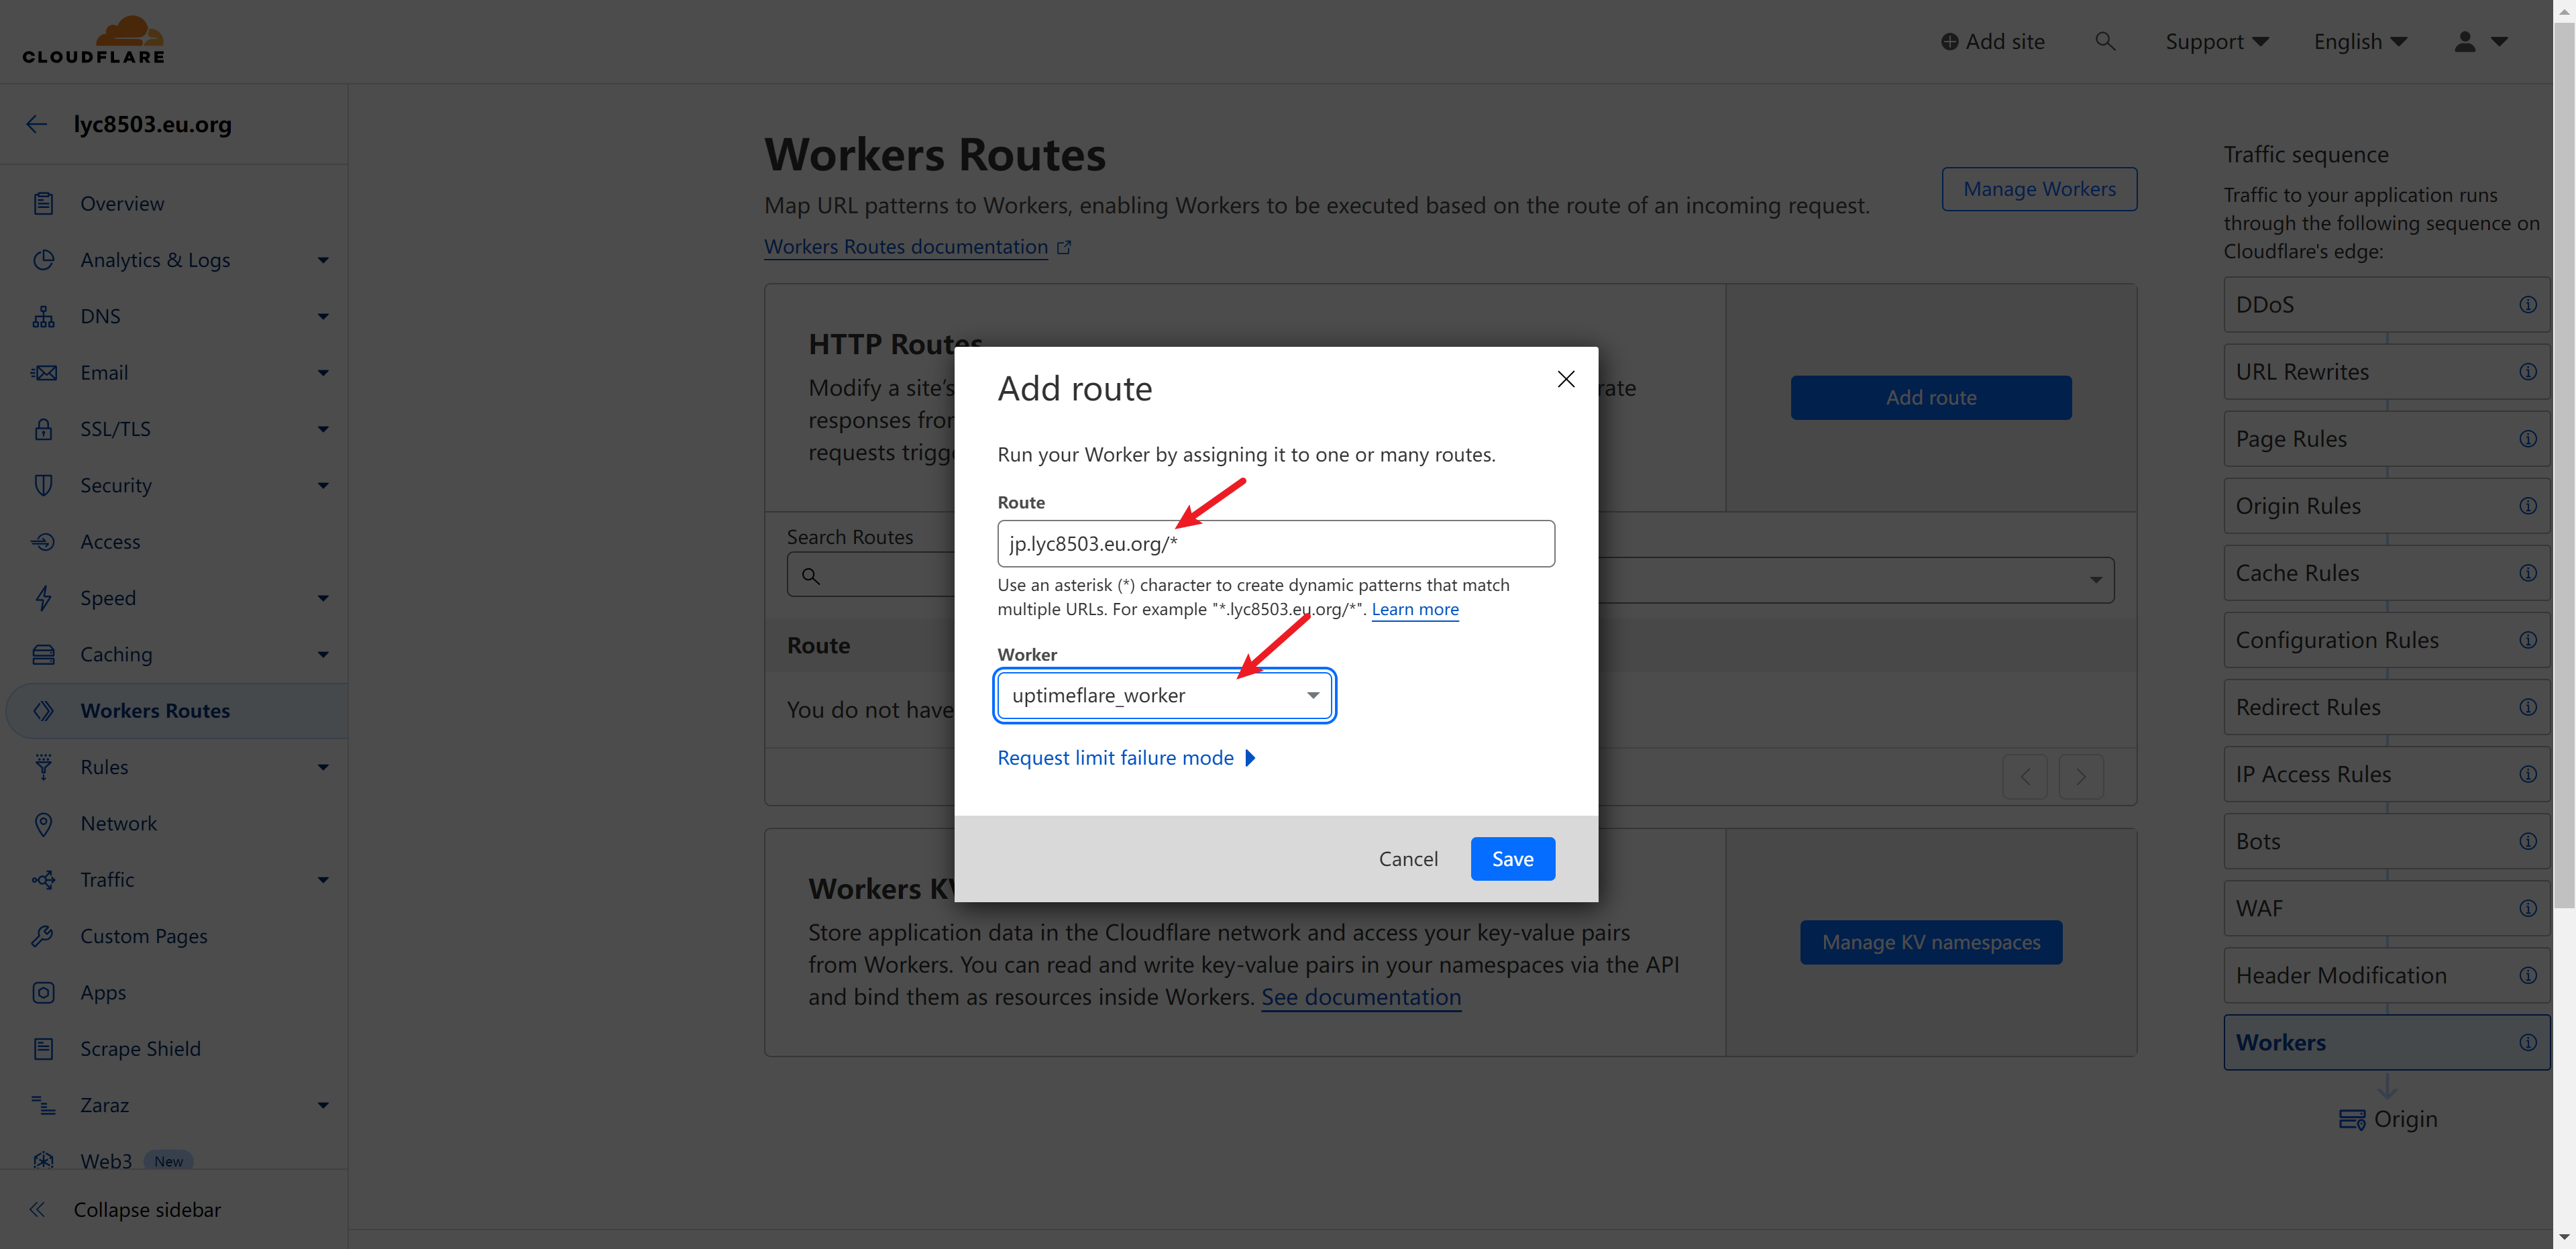
添加一条代理 DNS A 记录,以
jp作为名称,IP8.34.201.7作为内容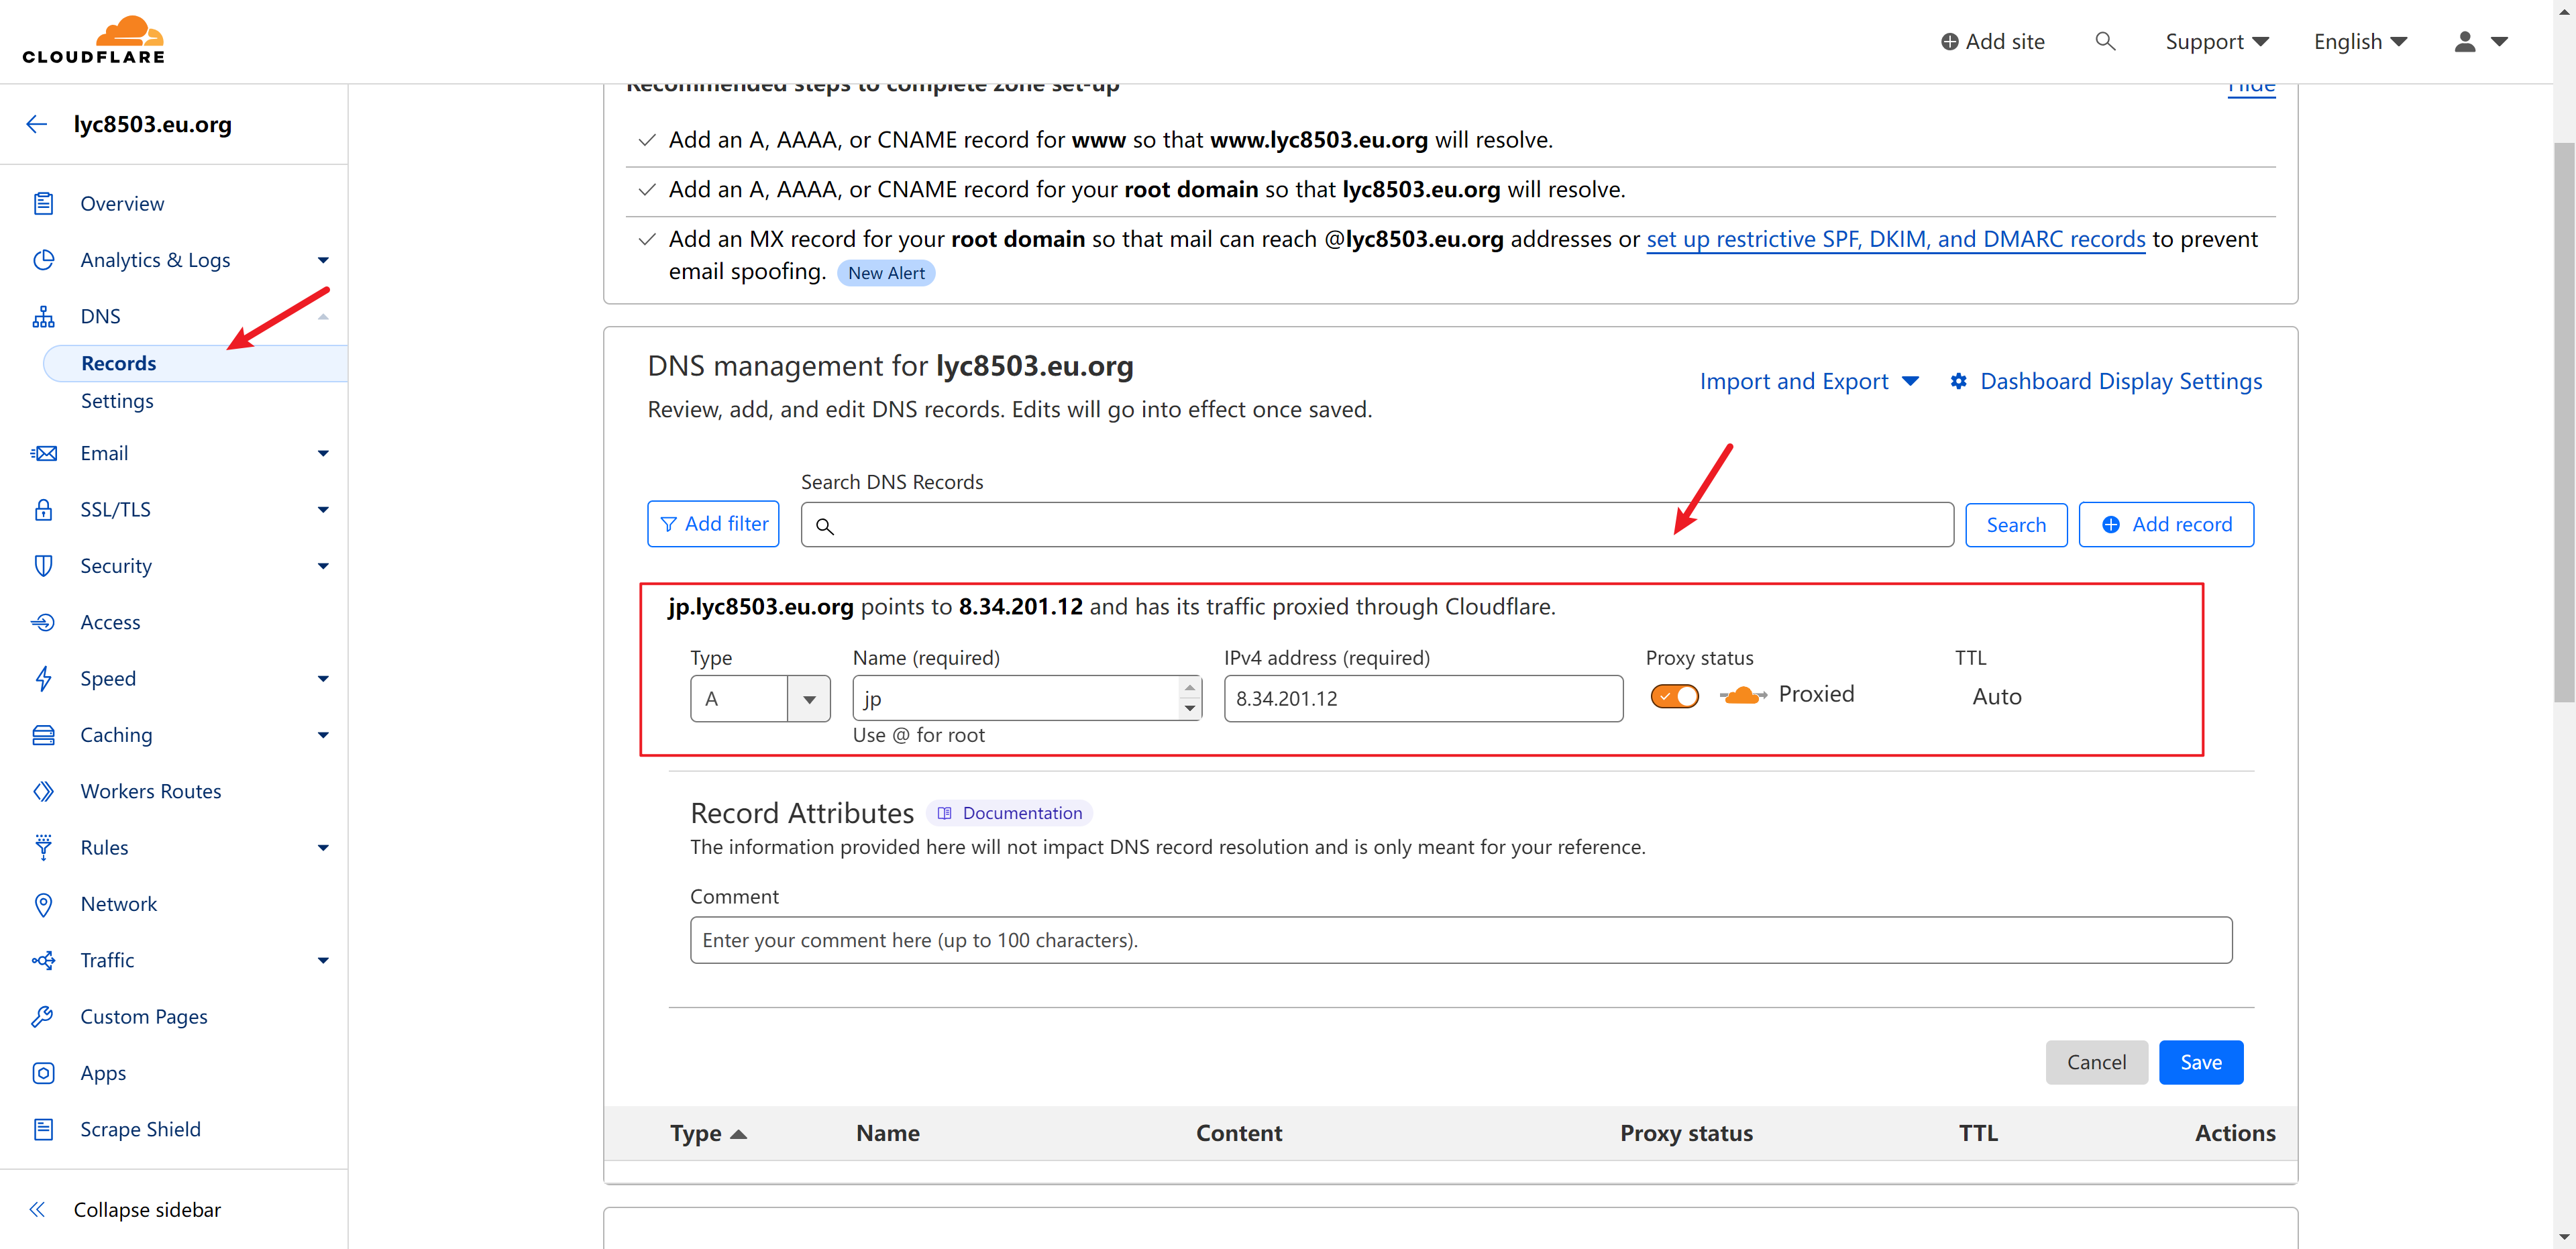
现在访问你配置的**
https://jp.xxxxxx.eu.org/**应该会显示Remote worker is working...,这里就配置成功了,现在在你的配置文件中加入checkLocationWorkerRoute: 'https://jp.xxxxx.eu.org/',就可以在特定的日本区域监控你的云服务。完整示例如下:ts{ id: 'blog_monitor',// id要唯一 name: 'Chino\'s Blog Monitor',// 监控器名称 method: 'GET', target: 'https://blog.kafuchino.top',// 监控的网站 tooltip: 'Chino的博客 - 分享技术和生活',// 显示的备注 statusPageLink: 'https://blog.kafuchino.top',// 点击跳转的网站 timeout: 15000, // 15秒超时 checkLocationWorkerRoute: 'https://jp.xxxxxx.ggff.net/',// 特定区域监控 },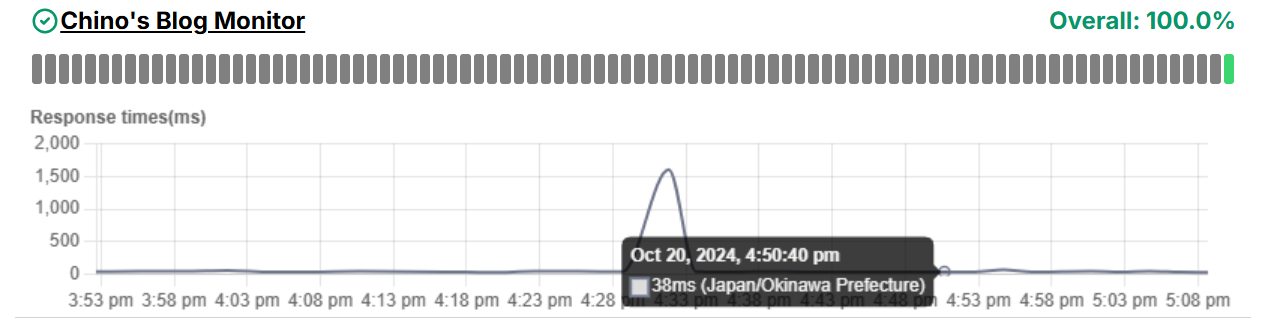
设置通知
- 你可以通过配置Apprise来发送通知,详细的通知配置查看Apprise wiki,这里展示快速配置tg机器人通知的示例
单击下面的按钮即可在您的 Vercel 帐户上部署 Apprise。
部署后,你将获得一个类似 的链接
https://apprise-8w2a74567-chino-projects.vercel.app/,附加/notify到该链接后,您将获得 Apprise API 服务器的链接:https://apprise-8w2a74567-chino-projects.vercel.app/notify,访问显示Apprise Vercel is working, use POST method to send notifications.说明部署成功配置tg机器人通知,形式是
tgram://botToken/chatId,如何获取机器人token和个人id请自行搜索教程,在此不再赘述填写
workerConfig.notification配置:
  notification: {
    appriseApiServer: "`https://apprise-8w2a74567-chino-projects.vercel.app/notify",
    recipientUrl: "tgram://8237645123:XYZk34bJL6SQBhzO8tAmzzpIOiRgrRROxv1/4572913845",
    // [可选] 通知消息中使用的时区,默认为 "Etc/GMT"
    timeZone: "Asia/Shanghai",
    // [可选] 发送通知前的宽限期(分钟)
    // 只有在监控连续N次检查后仍然处于故障状态时才会发送通知
    // 如果未指定,将立即发送通知
    gracePeriod: 5,
},配置正确的话,在你的服务故障的时候就会收到通知消息,消息形式如下
🔴 Chino YUN Monitor is currently down.
Service is unavailable at 10/20, 16:42. Issue: Expected codes: 2xx, Got: 502
✅ Chino YUN Monitor is up!
The service is up again after being down for 2 minutes.
总结
UptimeFlare作为无服务器免费站点监控工具,能支持 HTTP/HTTPS/TCP 多种协议的端口监控,还能自定义监控地理位置,能够自定义通知服务,功能能满足大部分个人网站的需要,非常适合部署一个来监控自己的站点。当然缺点也很明显,没有Uptime Kuma那样的图形化界面,填写配置文件较为繁琐,不过毕竟不需要服务器,还是相当不错的。
参考文档
- 本文链接:https://blog.kafuchino.top/posts/2024-09-23
- 版权声明:本博客所有文章除特别声明外,均默认采用 CC BY-NC-SA 许可协议。

